graph LR
    A[Acquisition] --> B(Activation);
    B --> C{Retention};
    C --> D[Revenue];
    D --> E(Referral);
    E --> A;
Lean Analytics: A Summary Focused on Actionable Insights
Lean Analytics provides a practical framework for applying Lean Startup principles to the measurement and analysis of business activities. It’s not just about collecting data; it’s about using data strategically to validate assumptions, iterate quickly, and achieve sustainable growth. The core message revolves around focusing efforts on the most impactful metrics and avoiding the trap of “vanity metrics.” The book emphasizes a scientific approach to business decision-making, based on experimentation and continuous learning.
Understanding Your Engine of Growth
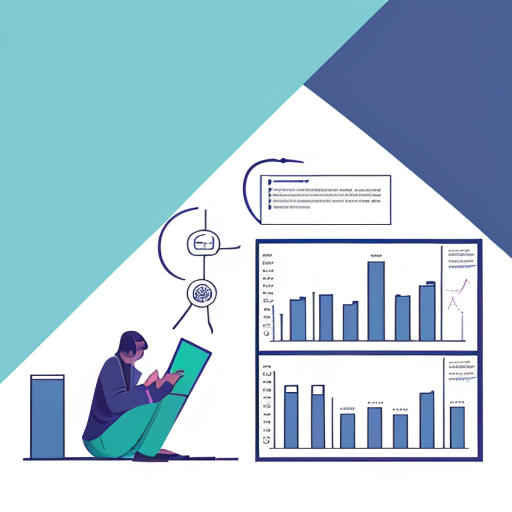
The book starts by defining the “engine of growth,” a visual representation of how your business acquires and retains customers. Understanding this engine is important for identifying the key metrics that matter most. Different businesses have different engines; there’s no one-size-fits-all approach. Analyzing your engine of growth allows you to focus on the right levers to pull for optimization.
This simple diagram represents a common engine of growth. Analyzing each stage reveals critical areas for improvement. For instance, low activation rates might signal problems with your onboarding process, while poor retention indicates issues with product-market fit or customer service.
Defining the Right Metrics
Lean Analytics stresses the importance of choosing the right metrics – those that directly correlate with your business goals. Avoid getting bogged down in vanity metrics (e.g., website visitors without conversion) which often provide a false sense of progress. Instead, focus on metrics that reflect actual progress towards achieving your objectives.
This involves a rigorous process:
- Defining your business goals: What are you trying to achieve?
- Identifying key assumptions: What needs to be true for you to succeed?
- Formulating testable hypotheses: How can you test these assumptions?
- Choosing appropriate metrics: What data will provide evidence to validate or invalidate your hypotheses?
For example, if your goal is to increase revenue, simply tracking website traffic is insufficient. Instead, focus on conversion rates, average order value, and customer lifetime value.
Prioritizing Through the “Lean Canvas”
The Lean Canvas is a one-page business model that helps visualize your business and prioritize efforts. It includes key elements like:
- Problem: The problem your product solves.
- Solution: Your product or service.
- Key Metrics: The metrics you’ll track.
- Unique Value Proposition (UVP): What makes your product different.
- Unfair Advantage: What protects your business from competition.
- Customer Segments: Who are your target customers?
- Channels: How do you reach your customers?
- Cost Structure: What are your costs?
- Revenue Streams: How do you generate revenue?
The Lean Canvas is a dynamic tool; it should be updated regularly as your understanding of your business evolves.
Experimentation and Iteration: The Core of Lean Analytics
The book strongly advocates for a culture of experimentation. This involves formulating hypotheses, designing experiments to test them, analyzing the results, and iterating based on the findings. The iterative nature of this process is key to achieving continuous improvement.
A/B testing is a cornerstone of this approach. By testing different variations of your product or marketing messages, you can identify what resonates most with your customers and optimize for better performance.
Example: Testing two different headlines on your landing page to see which one generates a higher conversion rate.
The Four Key Metrics
Lean Analytics introduces four core metrics that are generally applicable across many businesses:
- Acquisition: How many new customers are you acquiring? (e.g., website signups, app downloads)
- Activation: How many of those acquired customers are actively using your product? (e.g., completed onboarding, first purchase)
- Retention: How many customers are staying engaged over time? (e.g., monthly active users, customer churn rate)
- Revenue: How much money are you making? (e.g., monthly recurring revenue, average revenue per user)
Understanding and optimizing these four metrics provides a solid foundation for business growth.
Data Analysis Techniques
The book introduces practical data analysis techniques to help make sense of collected data. It emphasizes the importance of understanding the data context and avoiding misleading interpretations. Techniques like cohort analysis, funnel analysis, and statistical significance testing are introduced to provide a better understanding of performance.
Building a Data-Driven Culture
Ultimately, Lean Analytics aims to create a data-driven culture within an organization. This involves empowering employees at all levels to use data to make informed decisions, encouraging experimentation, and fostering a culture of continuous learning.
This requires:
- Accessible Data: Making data easily accessible to those who need it.
- Data Literacy: Ensuring employees have the skills to interpret data effectively.
- Clear Goals and Metrics: Aligning data analysis with clear business objectives.
- Feedback Loops: Implementing systems for gathering and acting on feedback.
Actionable Steps for Personal Improvement
While focused on business, Lean Analytics offers many actionable applications to personal life:
- Goal Setting & Prioritization: Defining clear personal goals and prioritizing tasks based on their impact. Use a personal “Lean Canvas” to outline your objectives and the metrics you’ll use to track your progress.
- Habit Tracking & Improvement: Track key habits and use data to identify areas for improvement. Experiment with different approaches to achieve desired outcomes.
- Learning & Development: A continuous learning mindset. Experiment with different learning methods to identify what works best for you.
- Time Management: Track how you spend your time and identify areas where you can be more efficient. Experiment with different time management techniques.
In essence, Lean Analytics promotes a scientific approach to life – identifying your goals, formulating hypotheses, experimenting with different approaches, measuring the results, and iterating based on the data. This framework helps you make more informed decisions and achieve your objectives more efficiently, whether in business or in your personal life. The key takeaway is continuous improvement through data-driven decision-making and experimentation.